Nov 8, 2019 12:00:00 AM
Articles on the release of the National Assessment of Education Progress (NAEP) scores rang an alarm of familiar decline: “Math scores remained relatively flat in most states” and “U.S. education achievement slides backwards,” with “a disturbing decline in reading scores.”
None of them are entirely wrong, but the reporting of the data in a single way leads policymakers and the public to miss seeing more nuanced stories of success and failure. If we follow the same groups of students and trace other performance levels over time we get completely different stories. There’s actually more progress in reading—and an even more troubling slide in math—than we’ve been led previously to see.
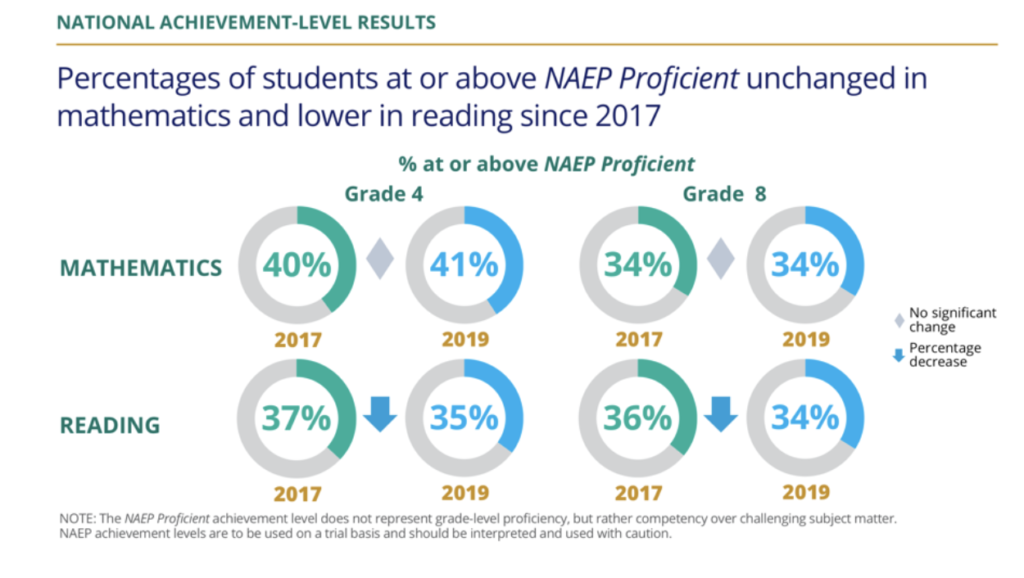
The National Assessment Governing Board (NAGB) currently compares a sample of last year’s fourth and eighth grade students to a sample of fourth and eighth graders from two years earlier. These are presented as snapshots, such as this infographic in The Nation’s Report Card:

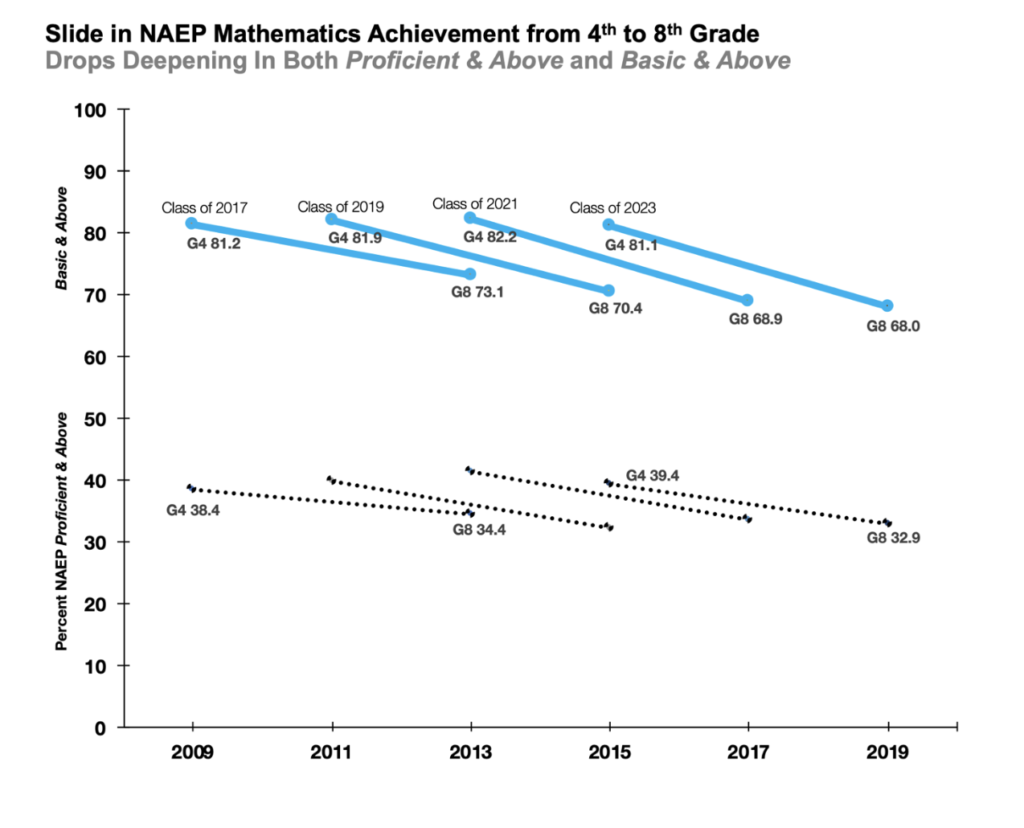
But we can also take the eighth graders tested in each year and see how their achievement has changed since they were in fourth grade, four years earlier. What happens when we trace the progress of the same groups of students over time? In mathematics, it’s a much more troubling picture.

When we connect the dots between fourth and eighth grade students in math, the trend isn’t one of stagnation, but of decline. In the chart above, each blue and dotted black line is organized by when a group of students will eventually graduate from high school. A sample of the Class of 2023 took the fourth grade NAEP in 2015, and then took it again as eighth graders in 2019. For each of five classes, the slide from elementary to middle school is occurring at both the “Proficient & Above” (the dotted black lines) and “Basic & Above” levels.
It might be tempting for some to blame Common Core, but the slides shown in each class predate implementation of the new standards, though they are getting worse over time. The new standards lay out an ambitious progression for teaching fractions that’s probably taking elementary and middle school teachers time to get adjusted to. Before the Common Core, addition and subtraction of fractions was introduced anywhere from third to seventh grade. Now, unit fractions are introduced in third grade and developed in a careful sequence that extends partially into sixth grade. Teachers and their students may still struggle with understanding the logic underlying multiplying and dividing fractions. This likely contributes to lower eighth grade achievement.
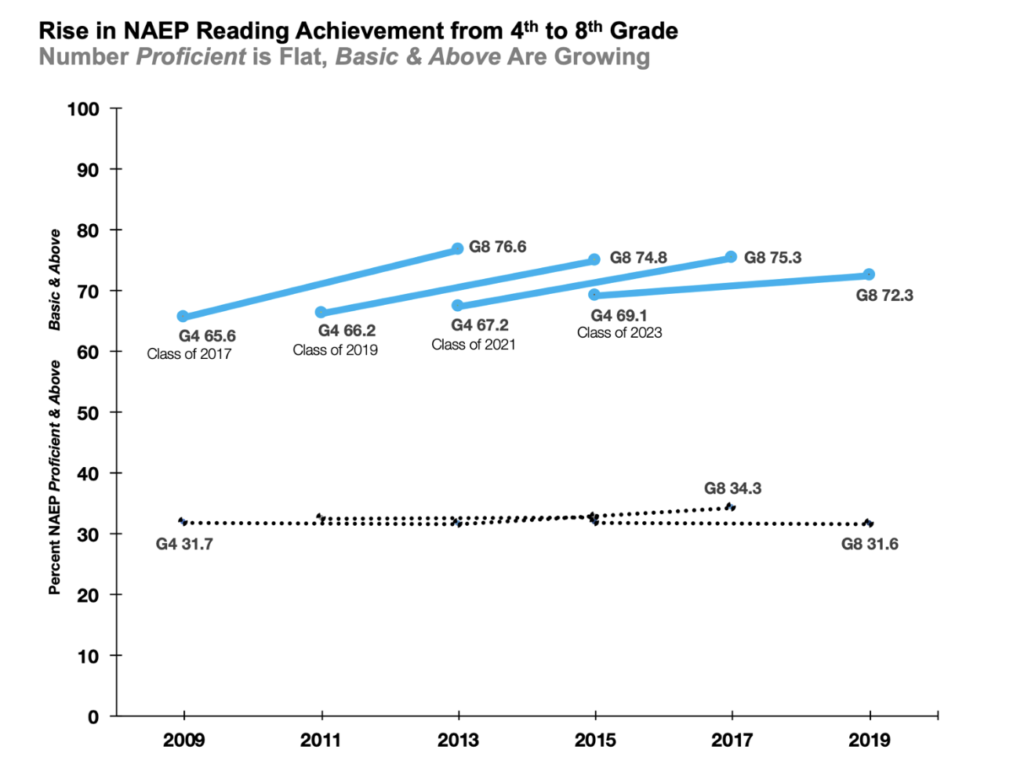
For reading achievement, the stories emphasized that NAEP “Proficiency” rates have been flat, which is true. But it’s a massive mistake to leap and conclude there’s been no progress in reading whatsoever.
In the chart below, there’s a consistent increase over time in the percentage of students scoring at NAEP “Basic & Above” (the light blue lines). As they move from elementary to middle school, each class grows its reading achievement at the “Basic” level by about 8% on average. Practically, what does this mean? What can they do differently as eighth grade readers that they couldn’t do before?

The NAEP Item Maps show that students who read at “Below Basic” in fourth grade struggle to explain the importance of a character in a story’s action. Those who move to the “Basic” level by eighth grade can now recognize the main reasons for a character’s actions in a story and can identify the main purpose in informational articles. There’s more they need to be able to do to become proficient readers, but this is important progress policymakers and school leaders aren’t recognizing and learning from.
It’s also clear in the chart above that [pullquote]each successive group of fourth graders has had higher starting points than each of the previous classes.[/pullquote] For the fourth graders in 2009, who would go on to graduate from high school in 2017, 65.6% of them read at NAEP “Basic and Above.” For the fourth graders who took NAEP in 2015 and will eventually graduate from high school in the Class of 2023, 69.1% started reading at “Basic and Above” levels.
A common problem in the reporting is the over-reliance on quotes and judgments from NCES officials and Secretary of Education Betsy DeVos. NAEP “Proficiency” is still provisional and is not synonymous with “proficiency” in the subject. In a 2017 report, the National Research Council wrote, “the ‘Proficient’ level does not reflect ‘at grade’ performance; the ‘Basic’ level is less than full mastery but more than minimal level competency; and even the best students may not meet the specified requirements for the ‘Advanced’ level.”
The impact of these stories cannot be overstated. Members of the Council of Chief State School Officers are considering hosting a national summit to discuss how to improve literacy in the nation. And because of the way everyone has seen the data, no such summit or new policy framework is being contemplated for mathematics.
Our nation’s achievement is both better and worse than we thought. What should school leaders and policymakers do? One obvious place to start would be to look at the data differently. Wherever possible, follow the same groups of students over time.
A second effort should be to build case studies of individual student success and failure. Examine a group of students who started out meeting standards in third and fourth grade and determine why they have slipped in middle school. Assemble a complete picture of their academic and social foundations. Similarly, examine a group of students who initially weren’t meeting standards and have grown to do so by eighth grade. What was different about their learning? This is a giant void in the field. Such cases will be invaluable to policymakers, school leaders and teachers, to help them build on current successes and avoid future failures.
David Scarlett Wakelyn is a former math teacher who helped develop the Common Core State Standards while at the National Governors Association. He is a partner at Union Square Learning.
The story you tell yourself about your own math ability tends to become true. This isn’t some Oprah aphorism about attracting what you want from the universe. Well, I guess it kind of is, but...
If you have a child with disabilities, you’re not alone: According to the latest data, over 7 million American schoolchildren — 14% of all students ages 3-21 — are classified as eligible for special...
The fight for educational equity has never been just about schools. The real North Star for this work is providing opportunities for each child to thrive into adulthood. This means that our advocacy...
Your donations support the voices who challenge decision makers to provide the learning opportunities all children need to thrive.
Ed Post is the flagship website platform of brightbeam, a 501(c3) network of education activists and influencers demanding a better education and a brighter future for every child.
© 2020–2024 brightbeam. All rights reserved.
Leave a Comment